Industry Benchmark Report 2026: What Really Drives Pentest Costs
Understand why penetration testing costs vary 2x-4x across similar application. A 2026 benchmark report on the real drivers of pentest effort, risk, and remediation cost.
%20(3).webp)


Why Penetration Testing Costs Vary in 2026
Penetration testing costs often differ by 2x to 4x across applications of similar size and scope. This variation is not driven by application scale alone. Based on aggregated AppSecure penetration testing engagements across SaaS, fintech, and enterprise environments, vulnerability depth and architectural risk explain the majority of cost differences.
This benchmark report explains how specific vulnerability categories, design patterns, and organizational practices disproportionately increase testing and retesting effort, and provides a structured framework for more predictable pentest budgeting.
Key Insights Included in the Report:
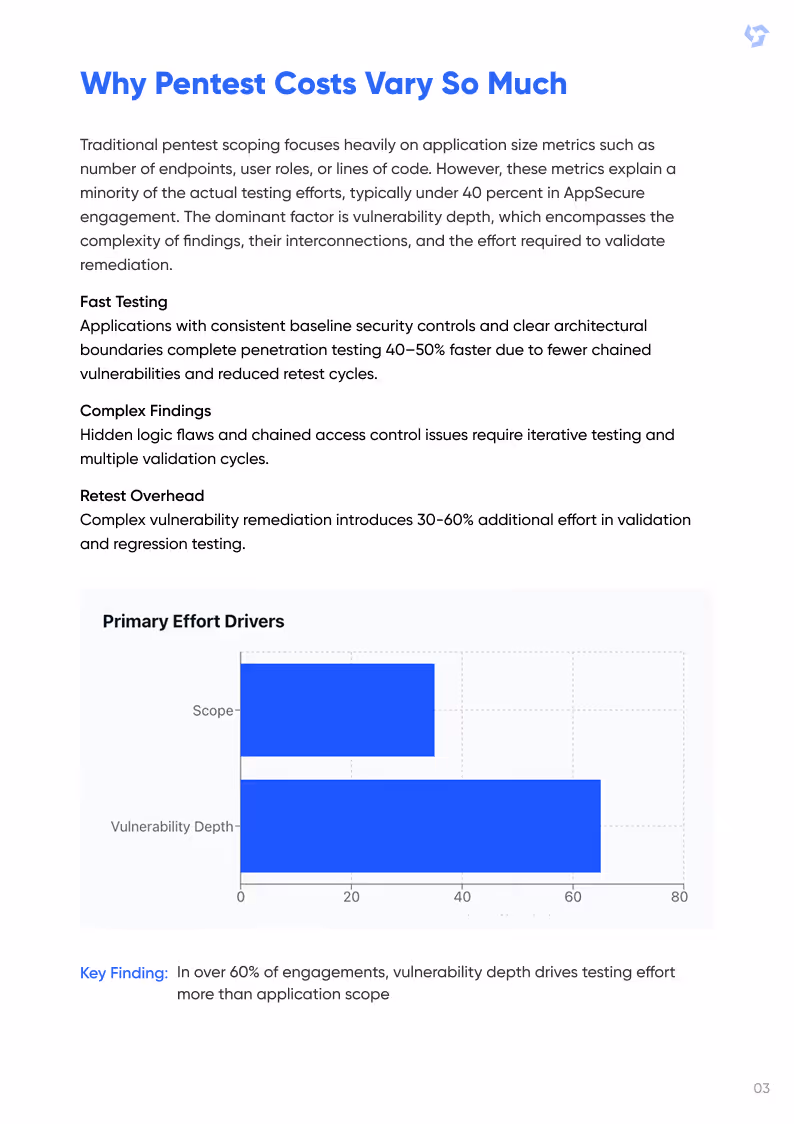
1. Primary Cost Drivers: Access control and business logic vulnerabilities account for the largest share of testing and validation effort.
2. Architectural Impact: Design-level security gaps extend remediation timelines and significantly increase total security costs.
3. Budgeting Framework: A practical approach to estimating pentest costs based on risk type, vulnerability depth, and application maturity.
.webp)
Inside the Report
A practical, data-driven roadmap to strengthen security and drive measurable outcomes.
.webp)